Jun 21, 2023
Shrinking Bundles, Expanding Forests
A few weeks ago, I gave a lightning talk about performance and sustainability at the Smashing Conf Jam Session in San Francisco. My talk went over a project my team at Help Scout had recently worked on, optimizing the performance of our third-party messaging widget, Beacon. You can find the slides here and watch the talk recording here. My talk is the first one in the recording, but all of the lightning talks were really good, so make sure you check them out as well!
As part of this project, we took the time to look into the environmental impact of the performance optimization—and it gave us some interesting results back. By shrinking Beacon’s bundle size from its original 262kb (gzipped) to between 33kb and 140kb, we reduced the amount of JavaScript we shipped from our CDN to client devices by about 60TB per month. That is a significant amount of data, and it had an impact on both costs Our CDN billing went down 38%, saving us $22k per year. and the environment.
Since my talk was only 10 minutes long, I only had a little time to dive into how we estimated the environmental impact. So I am writing this post to explore the topic further and point you to useful resources in case you want to adopt this for your own sites.
Here are a couple of slides I shared in my presentation:
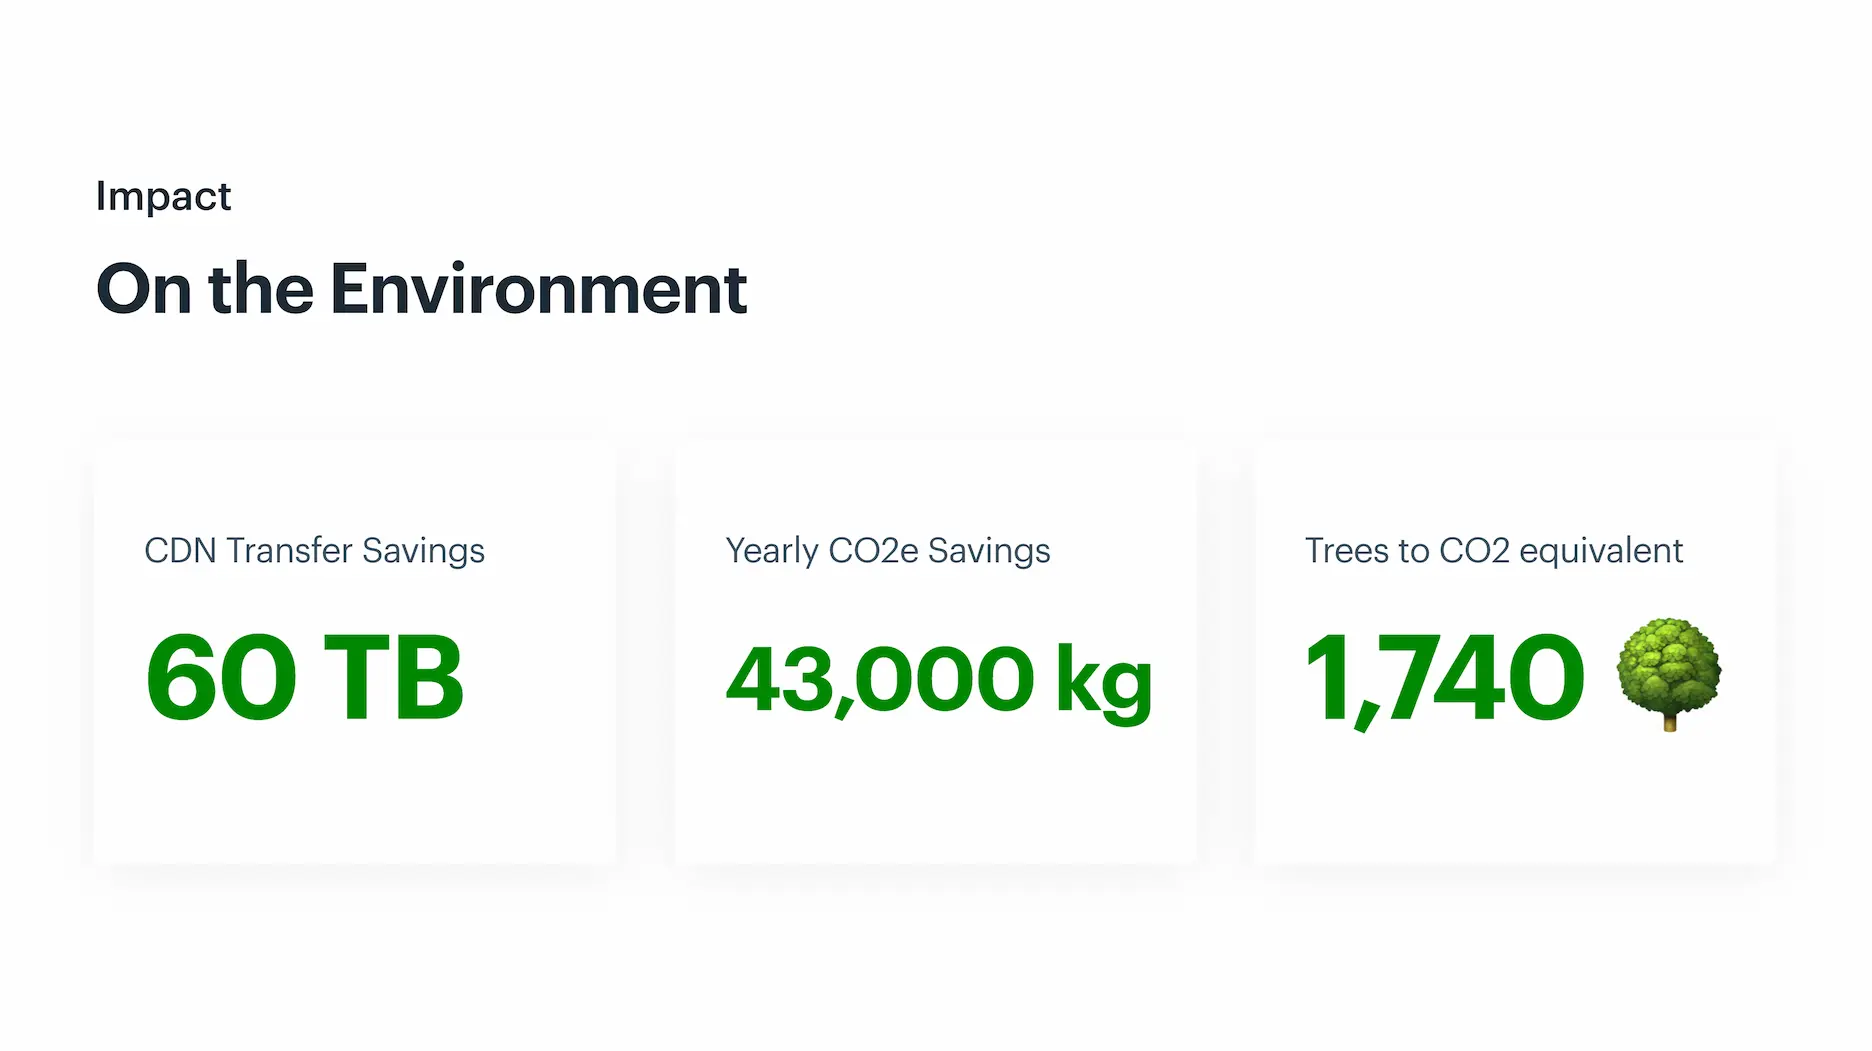
The first slide shows our estimates: reducing the transfer size by 60TB per month resulted in savings of 43,000kg of CO2e Carbon dioxide equivalent. per year, which is equivalent to the amount of CO2 absorbed by 1,740 trees per year.
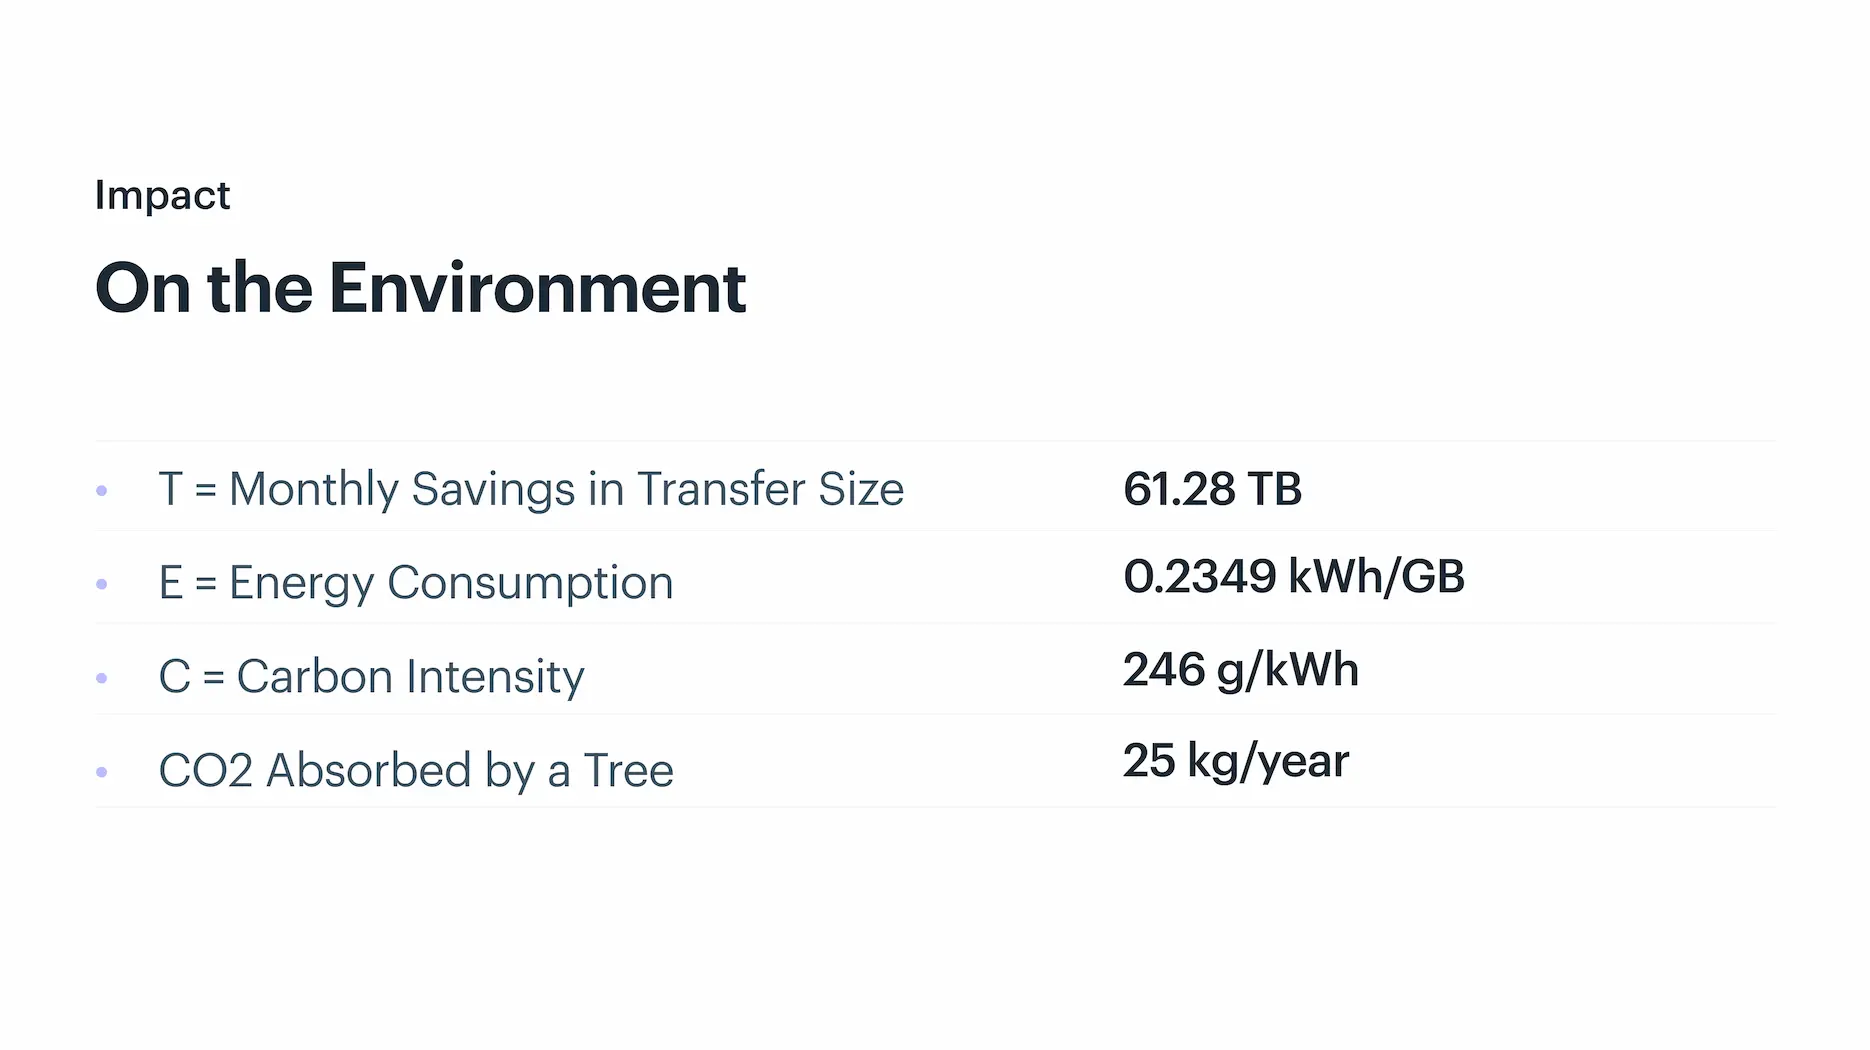
In the second slide, I show the numbers we used to get this result. Once you know these numbers, the formula to calculate CO2 emissions is straightforward—you multiply the first three values, which will give out the amount of CO2 in grams, and then divide by 1000 to get the value in kg:
CO2 = (T * 12) * E * C / 1000Then, if you want to make the CO2 to trees conversation, you divide that number further by 25:
🌳 = CO2 / 25Now, the question is, how exactly do you get those values? That is what we’ll discuss next.
A quick disclaimer before we dive in. Measuring the carbon emissions of a website is a complicated and inexact science, so everything you’ll read about in this blog post should be treated as an estimate. The numbers you’ll see throughout the article come from research by Sustainable Web Design and the Green Web Foundation, which is the closest I could find to a standard for web emissions. I’ll link to sources and relevant resources at the end of the post.
T = Monthly Transfer Size (GB)
How much data (in Gigabytes) is transferred from your servers to client devices.
You can get this value from your CDN or server logs. You can use your website’s total transfer size or choose a particular asset type. In our case, we wanted to measure our transfer savings, so we used how much data we were saving monthly after applying the performance improvements, which was about 61,280 GB.
E = Energy Consumption (kWh/GB)
How much energy is required to store, transfer, and execute one Gigabyte of data.
For energy consumption, we used the numbers reported by the Sustainable Web Design organization. Which they take from Anders Andrae’s study, New perspectives on internet electricity use in 2030. The value they suggest is 0.81 kWh/GB, however, you’ll notice that in our estimates we used a much smaller number: 0.2349 kWh/GB. Why is that?
The reason we chose a smaller value for energy consumption is that we wanted to be conservative with our estimates, only considering two out of the four segments that make up this number. According to Andrae’s study, energy consumption can be split into:
- Consumer device use (52%): how much energy is used by the end device. E.g.: when a JavaScript file is executed on your user’s phone, it drains the battery a tiny bit.
- Network use (14%): how much energy is used by the network to transfer the asset from the server to the client device.
- Data center use (15%): how much energy is required to store and save the data.
- Hardware production (19%): how much energy was required to produce all of the components involved in the system, including the servers, client devices, chips, fiber optic cables, etc.
Again, since we wanted to be conservative in our estimates, we only considered part of the entire system: network use and data center use, which account for 29% of the total energy (0.81 * 0.29 = 0.2349.) More on this below.
C = Carbon Intensity (g/kWh)
How much CO2 is released to the environment to produce one kilowatt-hour of energy.
For carbon intensity (or carbon factor), we also used the numbers reported by Sustainable Web Design, which in this case come from Ember’s Electricity Data Explorer. Carbon intensity varies drastically from country to country and depends on whether the energy was produced using a fossil or renewable resource.
Since our customers (and servers) are spread worldwide, we used the “world average” value of 442 g/kWh for fossil resources and 50 g/kWh for renewable resources. We also didn’t have any data at the time about whether AWS uses renewable sources for their servers, so we decided to average these two numbers–making the assumption that 50% of the energy is renewable–which is how we ended up with 246 g/kWh.
CO2 Absorbed by a Tree in a Year
This number comes from this website that calculates that a 1,000kg, 35-year-old tree would have absorbed roughly 25 kilograms of CO2 per year during its lifetime. I couldn’t find any peer-reviewed studies to verify this claim, but since this is simply to put things into perspective a little bit, I thought it was good enough for our report.
Source: ecotree
Conservative Estimates
Putting everything together, we get to our final value of saving 43,000kg of CO2 in annual emissions, or roughly 1,740 trees. As I mentioned earlier, these are estimates, so while I would love to be able to show you the exact trees we’re saving every year, that’s not how these estimates work.
That said, we didn’t want to overestimate our impact, so we tried to be conservative with the values we used to calculate carbon emissions.
- As mentioned in the Energy Consumption section, we only considered the energy used by part of the system (29%) instead of the entire system.
- The 60TB of transfer size only accounts for users that have to download the entire script from scratch (mostly first-time visitors), which is roughly 40% of the total number of requests. The remaining 60% of requests comes from recurring users who have the script cached on their browsers but still need to execute it. We didn’t count these users at all.
- For the carbon intensity number we used, I’m honestly not sure if we’re being conservative here, but we thought we were at the time. When we first estimated this, we couldn’t find a lot of information about how AWS powered their servers. But seeing that they are on track to be 100% powered by renewal energy by 2025, it does seem that we could have used a smaller number. In any case, if it turned out we were already greener than we thought, that would be a delightful surprise.
Resources
A massive thank you goes to the very smart and dedicated people who have researched (and continue to research) sustainability on the web. The only reason we can make these estimates is thanks to their hard work.
If you’re interested in learning more about this topic and estimating the environmental impact of your sites, here are some of the resources I’ve found most useful:
- Sustainable Web Design
- Website Carbon Calculator
- Why do estimates for internet energy consumption vary so drastically?
- How much CO2 does a tree absorb?
- Green Web Foundation + co2.js
Thank you for reading~